


Developer tooling is a big priority for Mojo and MAX, we want to vastly improve the debugging experience compared to the traditional Python, C++, and CUDA stack. Machine learning often requires inspecting the state of a program after a long running process, requiring more control than what "print debugging" gives you. Over time this tooling will extend to GPUs, allowing you to step through CPU code into GPU calls with the same developer experience.
This tutorial is for VS Code, but can be adapted to other editors using LLDB-DAP. It's aimed at general debugging if you have no experience with it, but goes over all the currently implemented Mojo features. The goal is to show you how simple and powerful debugging is with Mojo, to improve your velocity tracking down logic errors beyond writing and deleting print statements.
Debug current file
First make sure you've installed the Mojo extension, or Mojo Nightly if you've installed the nightly compiler.
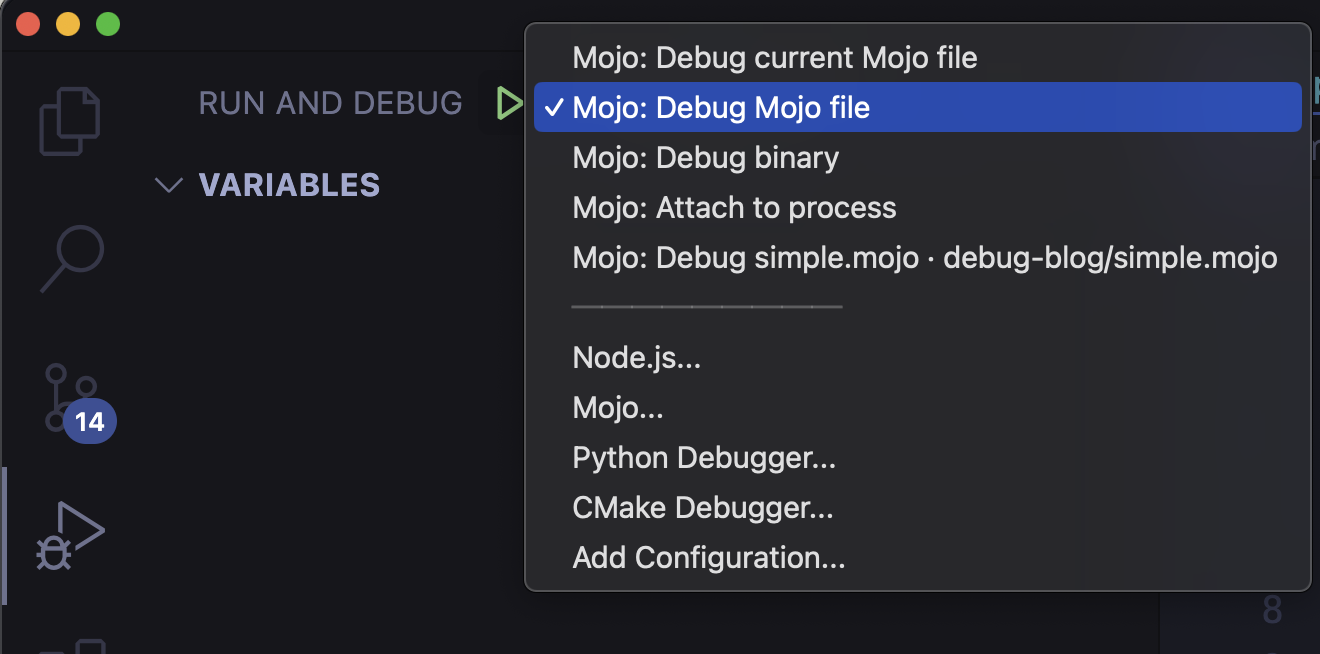
Let's start with the simplest way to boot up the debugger in VS Code, set a breakpoint by clicking to the left of a line to set a 🔴 Breakpoint, then press the ⌄ to the right of the ▶️ Play button in the top-right, and choose Debug Mojo File:
Note: you can expand any GIF by clicking it, and minimize by clicking anywhere or pressing any key.
Pressing the |▶ Continue button advances to the next break point, if the same line of code is being hit in a loop, this will advance to the next iteration in the loop.
Default Keybindings:
- F5: Start debugger (select Mojo on the first run if starting this way)
- F5: Continue to next breakpoint if the debugger has started
- Shift+F5: Stop the debug session
Control+Shift+P(Command+Shift+Pon macOS): Restart the debug session- F9: Toggle breakpoint on the current line
You can also launch the debugger from a terminal with:
Type in mojo debug --help for more options.
Step in, out, and over
A powerful feature is stepping into functions, out of them, and over any breakpoints you've set:
The first action is a Step Into the List.append method, followed by 2x Step Over to break at the following expression, and finally a Step Out to return to the original List.append breakpoint.
Default Shortcuts:
- F10: Step Over.
- F11: Step Into.
- Shift+F11: Step Out.
Mutating and inspecting variables
You can mutate variables mid-debug session! Simply click on a value to edit it. You can also use the debug console to index into variables:
Changing stack frame context
When you step into a function, the stack frame and local variables will change on the debug panel, you can view a different stack frame by clicking on it:
You'll notice the local variables in the debug panel change, you can inspect and modify them as usual.
Watches
Sometimes the local variable you're interested in won't be in the Locals section, or perhaps there are too many variables there, and you want to keep a specific variable at the top of the list, or you might want to use an expression such as indexing into a list. To achieve this you can press the ✚ button next to WATCH:
Logpoints
Instead of writing print statements into your program, and potentially committing them to your PR, you can use a log point expression which also has code completions via the Mojo LSP. Simple right click where you would normally set a breakpoint and choose Add Logpoint:
Hit Count
If you want to wait for x iterations until your breakpoint triggers, you can use a Hit Count. Right click a breakpoint location and select Conditional Breakpoint then change the selection to Hit Count, in the example I'm choosing the third iteration. Breakpoints are triggered just before the current line expression runs, which in this example is just before the third element is added to the List:
Wait for breakpoint
If you want to skip a breakpoint until another one has been triggered, you can use this. Right click a breakpoint location and select Triggered Breakpoint, then choose the other breakpoint you want to wait for:
Multithreaded debugging
You can also debug in a multithreaded context. If you go to the command input of the DEBUG CONSOLE, type in :thread list to see a list of the current threads, any threads that are currently paused due to breakpoints will display here. You can then change the stack frame into those threads to inspect local variables:
Custom Launch Configuration
If you need more control over your debug launch configuration for a larger program, or you're running server and client and you need to attach to a process, you can create a launch.json file. You can also commit this to the repo so other users can easily start a debug session. First Press the Debug icon on the sidebar, then click create a launch.json file and select Mojo to create a file at .vscode/launch.json:
Press Control + Space to discover all the configuration options. Make sure to change [your-program.mojo] and [your-binary] to your desired targets, and delete any configuration you don't need.
Now on the top right of the debug panel, you can select a launch configuration which will run when you press F5:
Coming Soon
- Break on error, for easily tracking down what part of your code is throwing.
- Conditional breakpoints, for expressions to break on True.
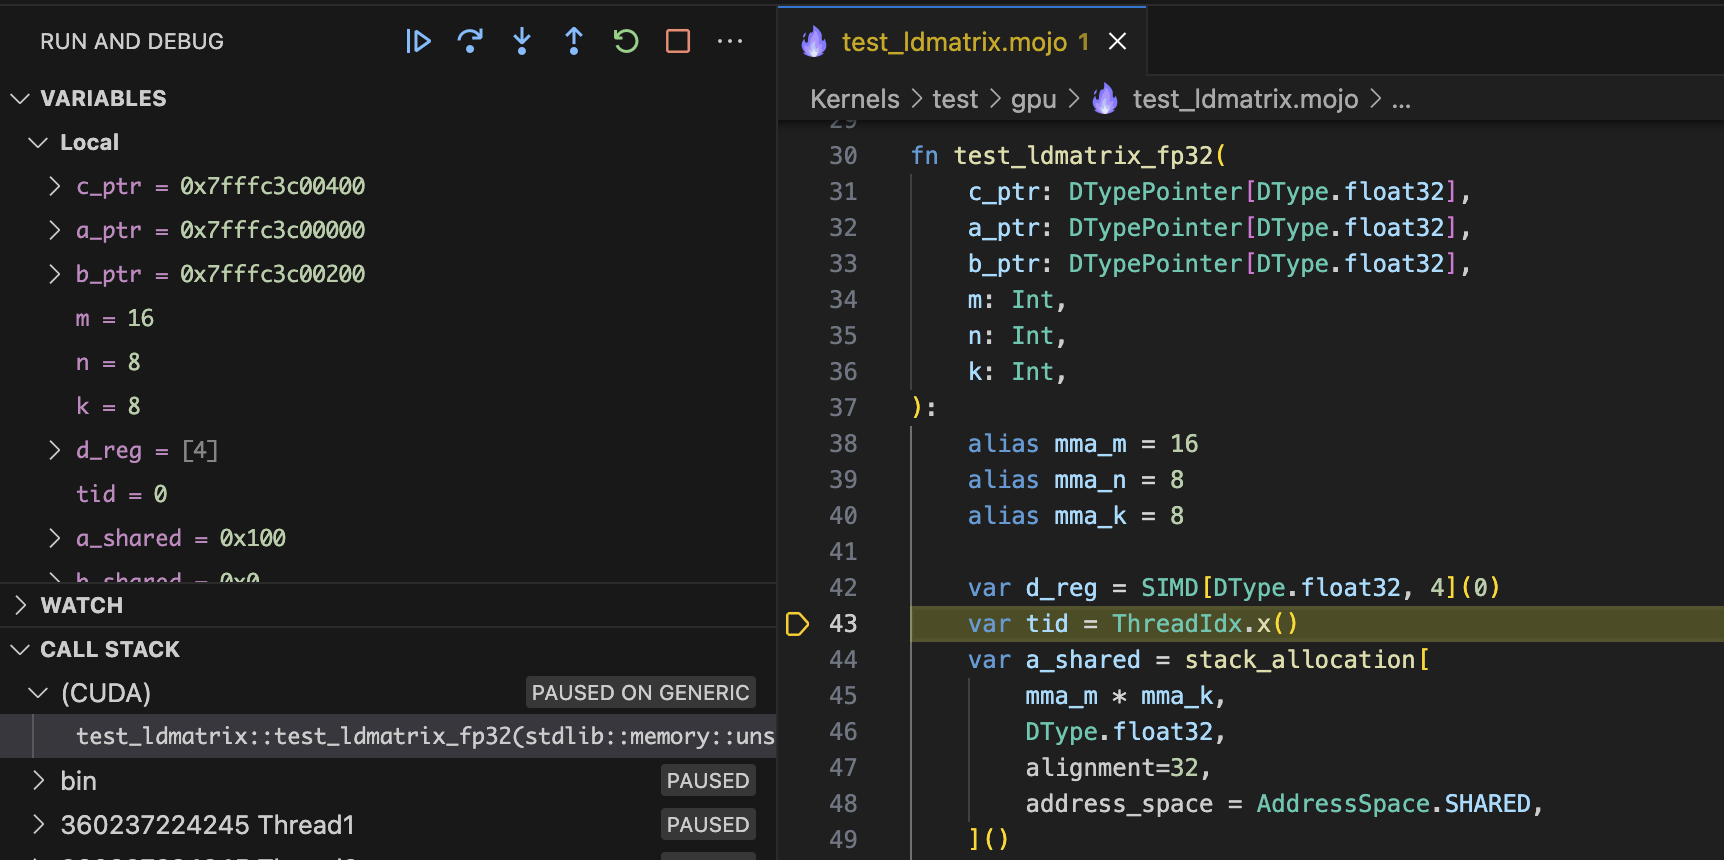
- GPU Debugging! See a preview below:
For more details on Mojo debugging check out the debugging docs.
For more details on VS Code debugging, check out their docs here.
Thank you for reading! Here are some additional Mojo resources:
- Get started with downloading Mojo
- Head over to the docs to read the programming manual and learn about APIs
- Explore the examples on GitHub
- Join our Discord community
- Contribute to discussions on the Mojo GitHub
- Read and subscribe to Modverse Newsletter
- Read Mojo blog posts, watch developer videos and past live streams
- Report feedback, including issues on our GitHub tracker